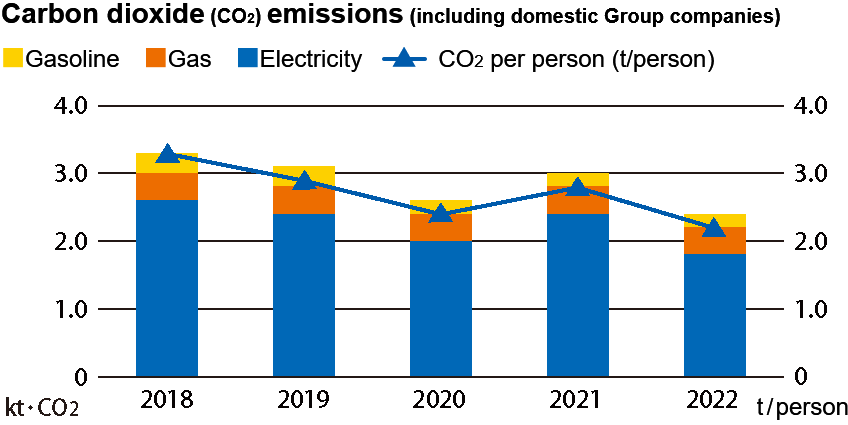
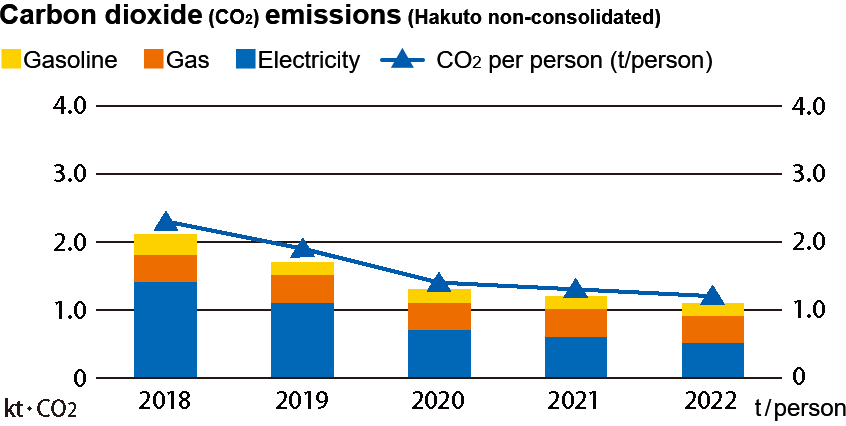
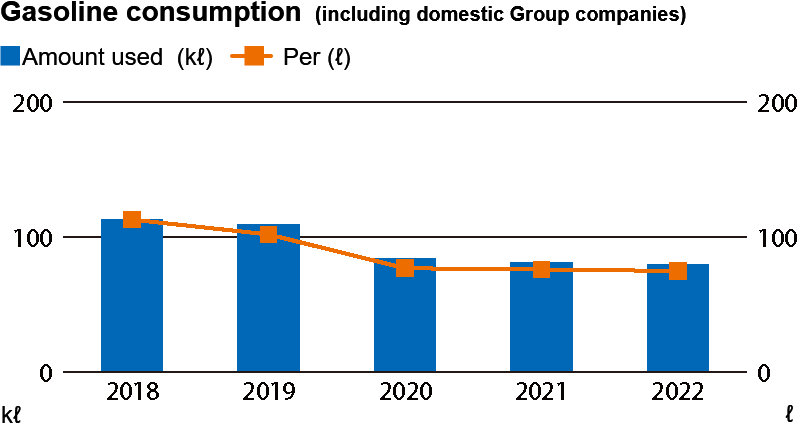
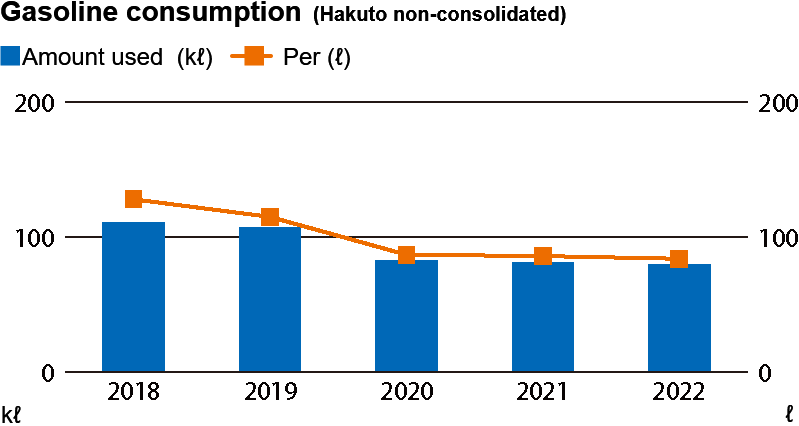
We aim to reduce emissions of carbon dioxide (CO2), a major greenhouse gas, by working to reduce electricity consumption to help prevent global warming. We are working to reduce electricity, gas, and gasoline consumption by optimizing the operating conditions of air conditioners and server systems for heating and cooling, stopping the idling of vehicles, switching to LED lighting, and turning off unnecessary lights in offices.
The graph below shows the change in CO2 emissions of our company and domestic subsidiaries over a five-year period from FY2018 to FY2022. As Chemical Solution Company electricity supply through the digital grid platform started at two business sites in the Chubu area from the June inspection date in FY2020, the emission factor was changed from the base factor to the adjusted emission factor from FY2020 onward. CO2 emissions decreased 8.2% on a non-consolidated basis and 20.4% on a Group basis due to a decrease in production at Group companies.
Carbon dioxide (CO2) emissions
- *Vertical bar, left scale: stacked value of electricity, gas, and gasoline; Line graph, right scale: Emissions per employee
Standards for calculation
- Electricity: Based on "Actual and adjusted emission factors for each electric utility" published by the Ministry of the Environment.
- Gas, gasoline and kerosene: Based on the "List of Calculation Methods and Emission Factors in the Calculation, Reporting, and Publication System," revised March 2010, published by the Ministry of the Environment.
- *From FY2022, Sustana (CO2 calculation system) has been introduced to manage coefficients.
Substances subject to PRTR
Under the PRTR Law (*1), which requires that emissions and transfers of chemical substances be monitored and reported, the Yokkaichi Factory of the Chemical Solution Company, which handles chemical substances, reports the following amounts handled, emitted, transferred, and consumed to the prefectural government.
Reportable substances: [Class 1 designated chemical substances whose annual handling volume is "1 ton or more"], [Specified Class 1 substances whose annual handling volume is "0.5 ton" or more].
- *1Official Name: Act on the Assessment of Releases of Specified Chemical Substances in the Environment and the Promotion of Management Improvement
Release and transfer of PRTR substances (2022)
Unit: kg
| Target substance number: Substance name and content |
Amount handled |
Amount transferred to sewer |
Amount moved off-site |
Amount released into the air |
Total |
| 1: Water-soluble compound of zinc (Class 1, No. 1) |
1,990 |
1.6 |
23 |
0 |
24.6 |
| 4: Acrylic acid and its water-soluble salts (Class 1, No. 4) |
32,418 |
0 |
0 |
0 |
0.0 |
| 20: 2-aminoethanol (Class 1, No. 20) |
20,269 |
20 |
280 |
0 |
300 |
| 30: Linear alkyl benzene sulfonic acid and its salts (C10-14) (Class 1, No. 30) |
8,076 |
0 |
120 |
0 |
120 |
| 53: Ethylbenzene (Class 1, No. 53) |
27,250 |
0 |
150 |
0 |
150 |
| 80: Xylene (Class 1, No. 80) |
6,473 |
0 |
50 |
3.7 |
53.7 |
| 210: 2,2-Dibromo-2-cyanoacetamide (Class 1, No. 210) |
24,084 |
0.2 |
0.9 |
0 |
1.1 |
| 232: N, N-Dimethylformamide (Class 1, No. 232) |
7,867 |
7.9 |
110 |
0 |
117.9 |
| 296: 1,2,4-Trimethylbenzene (Class 1, No. 296) |
24,547 |
0 |
130 |
0.6 |
130.6 |
| 297: 1,3,5-Trimethylbenzene (Class 1, No. 297) |
4,661 |
0 |
26 |
0 |
26 |
| 302: Naphthalene (Class 1, No. 302) |
7,622 |
0 |
46 |
0 |
46 |
| 333: Hydrazine (Class 1, No. 333) |
5,021 |
5.0 |
70 |
0 |
75 |
| 395: Water-soluble salts of peroxodisulfuric acid (Class 1, No. 395) |
1,260 |
1.3 |
5 |
0 |
6.3 |
| 414: Maleic anhydride (Class 1, No. 414) |
13,269 |
0 |
0 |
0 |
0 |
| 455: Morpholine (Class 1, No. 455) |
20,501 |
20 |
290 |
0 |
310 |
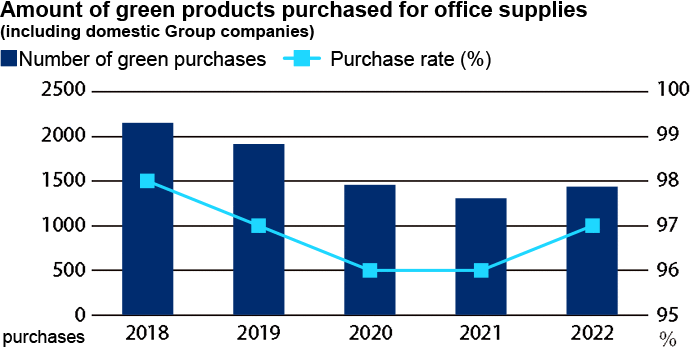
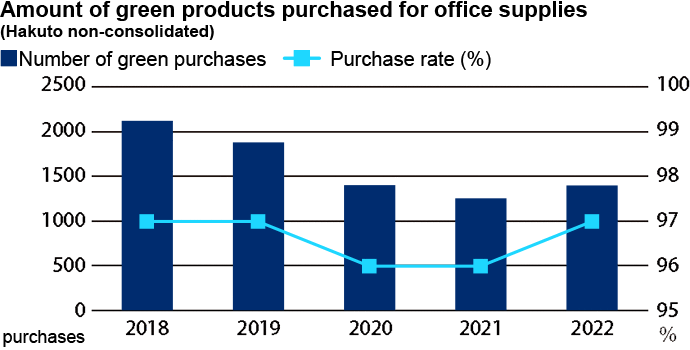
Amount of green products purchased for office supplies
- *Vertical bar, left scale: Number of green purchases; Line graph, right scale: Green purchasing rate
| FY |
Number of green products purchased |
Purchase rate |
| 2018 |
2145 purchases |
98% |
| 2019 |
1908 purchases |
97% |
| 2020 |
1452 purchases |
96% |
| 2021 |
1302 purchases |
96% |
| 2022 |
1432 purchases |
97% |
| FY |
Number of green products purchased |
Purchase rate |
| 2018 |
2118 purchases |
97% |
| 2019 |
1877 purchases |
97% |
| 2020 |
1399 purchases |
96% |
| 2021 |
1251 purchases |
96% |
| 2022 |
1395 purchases |
97% |
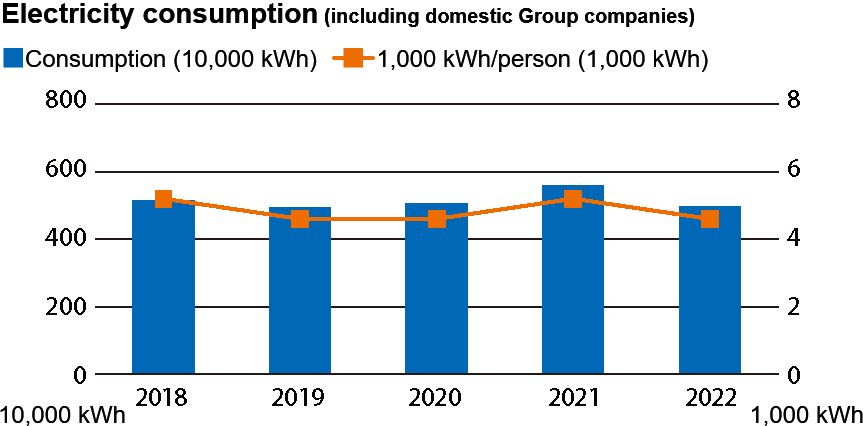
Amount of electricity used
- *Vertical bar, left scale: Total amount; line chart, right scale: Amount per employee
| FY |
Total consumption |
Per employee |
| 2018 |
5,160,000 kWh |
5,200 kWh |
| 2019 |
4,940,000 kWh |
4,600 kWh |
| 2020 |
5,050,000 kWh |
4,600 kWh |
| 2021 |
5,600,000 kWh |
5,200 kWh |
| 2022 |
4,970,000 kWh |
4,600 kWh |
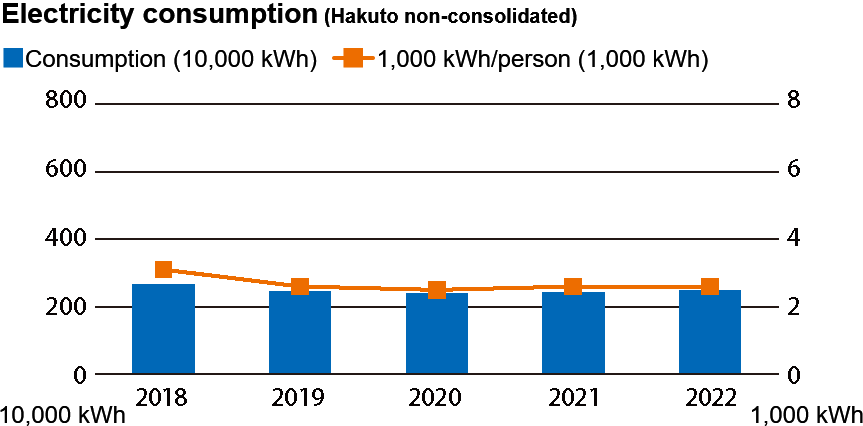
| FY |
Total consumption |
Per employee |
| 2018 |
2,670,000 kWh |
3,100 kWh |
| 2019 |
2,450,000 kWh |
2,600 kWh |
| 2020 |
2,400,000 kWh |
2,500 kWh |
| 2021 |
2,430,000 kWh |
2,600 kWh |
| 2022 |
2,470,000 kWh |
2,600 kWh |
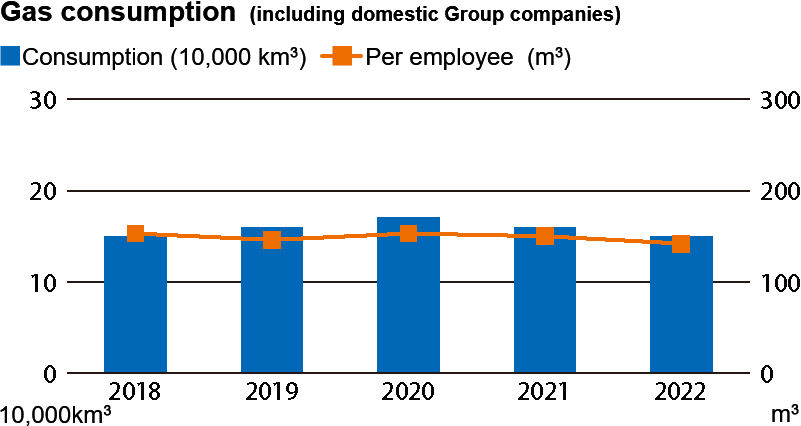
- *Vertical bar, left scale: Total amount; line chart, right scale: Amount per employee
| FY |
Total consumption |
Per employee |
| 2018 |
150,000km3 |
153m3 |
| 2019 |
160,000km3 |
146m3 |
| 2020 |
170,000km3 |
153m3 |
| 2021 |
160,000km3 |
150m3 |
| 2022 |
150,000km3 |
142m3 |
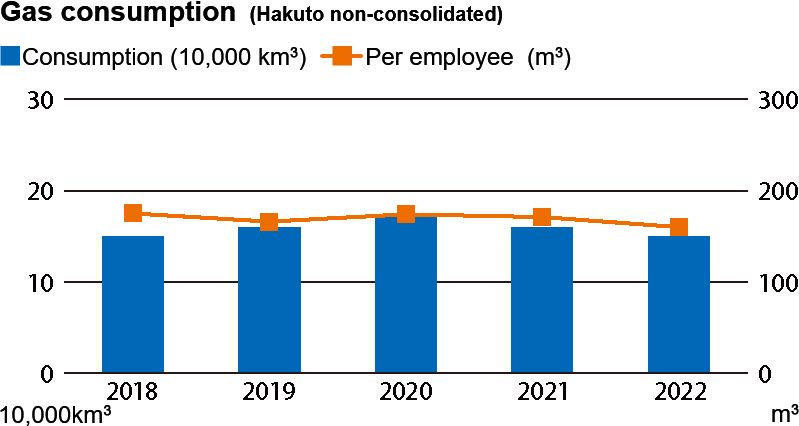
| FY |
Total consumption |
Per employee |
| 2018 |
150,000km3 |
175m3 |
| 2019 |
160,000km3 |
166m3 |
| 2020 |
170,000km3 |
174m3 |
| 2021 |
160,000km3 |
171m3 |
| 2022 |
150,000km3 |
160m3 |
- *Vertical bar, left scale: Total amount; line chart, right scale: Amount per employee
| FY |
Total consumption |
Per employee |
| 2018 |
113k liters |
113 liters |
| 2019 |
109k liters |
102 liters |
| 2020 |
84k liters |
77 liters |
| 2021 |
81k liters |
76 liters |
| 2022 |
80k liters |
75 liters |
| FY |
Total consumption |
Per employee |
| 2018 |
111k liters |
128 liters |
| 2019 |
107k liters |
115 liters |
| 2020 |
83k liters |
87 liters |
| 2021 |
81k liters |
86 liters |
| 2022 |
80k liters |
84 liters |
The number of hybrid, four-star, and three-star vehicles with vehicle emissions compliance is 92.2%.
| Hybrid |
★★★★
Compliant car |
★★★
Compliant car |
Not applicable |
Total |
| 29 |
40 |
2 |
6 |
77 |
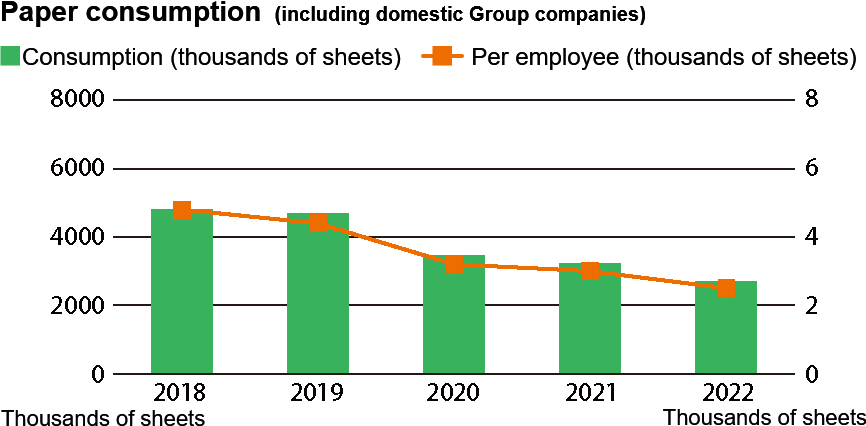
- *Vertical bar, left scale: Total amount; line chart, right scale: Amount per employee
| FY |
Total consumption |
Per employee |
| 2018 |
4809 Thousands of sheets |
4.8 Thousands of sheets |
| 2019 |
4680 Thousands of sheets |
4.4 Thousands of sheets |
| 2020 |
3462 Thousands of sheets |
3.2 Thousands of sheets |
| 2021 |
3210 Thousands of sheets |
3.0 Thousands of sheets |
| 2022 |
2709 Thousands of sheets |
2.5 Thousands of sheets |
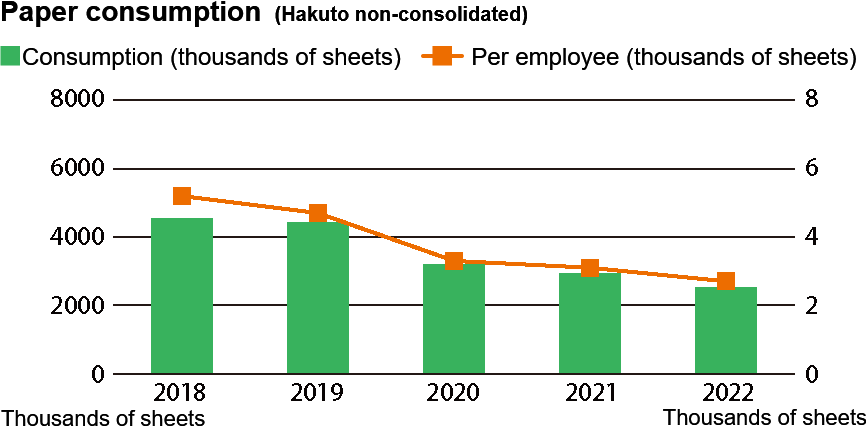
| FY |
Total consumption |
Per employee |
| 2018 |
4547 Thousands of sheets |
5.2 Thousands of sheets |
| 2019 |
4431 Thousands of sheets |
4.7 Thousands of sheets |
| 2020 |
3204 Thousands of sheets |
3.3 Thousands of sheets |
| 2021 |
2924 Thousands of sheets |
3.1 Thousands of sheets |
| 2022 |
2535 Thousands of sheets |
2.7 Thousands of sheets |
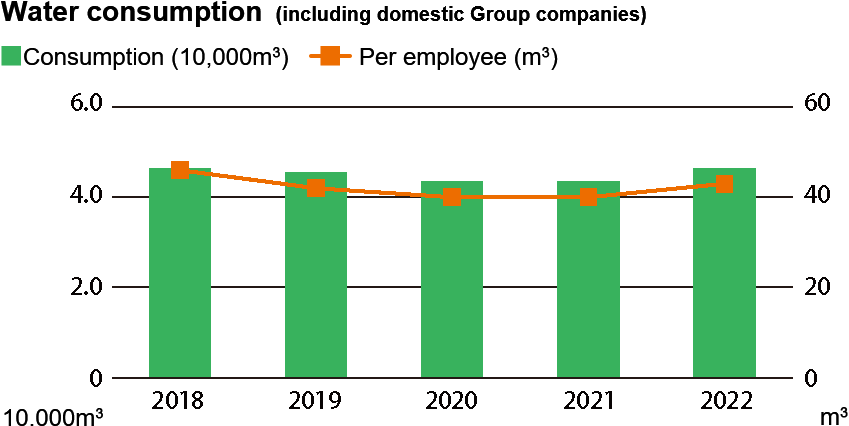
- *Vertical bar, left scale: Total amount; line chart, right scale: Amount per employee
| FY |
Total consumption |
Per employee |
| 2018 |
46,000m3 |
46m3 |
| 2019 |
45,000m3 |
42m3 |
| 2020 |
43,000m3 |
40m3 |
| 2021 |
43,000m3 |
40m3 |
| 2022 |
46,000m3 |
43m3 |
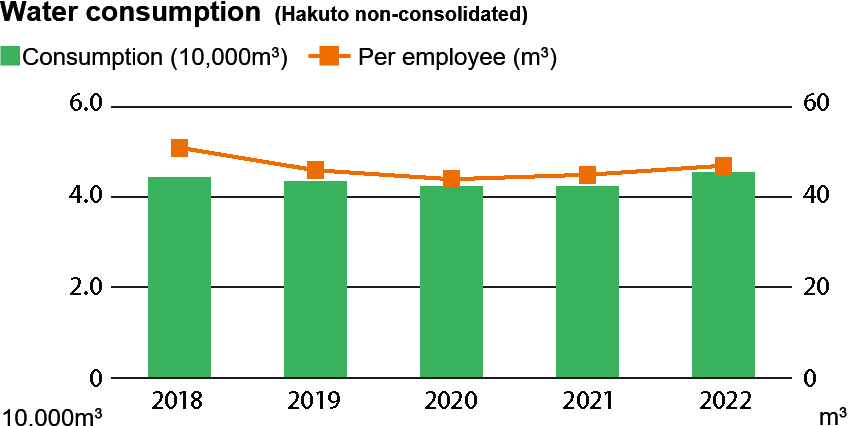
| FY |
Total consumption |
Per employee |
| 2018 |
44,000m3 |
51m3 |
| 2019 |
43,000m3 |
46m3 |
| 2020 |
42,000m3 |
44m3 |
| 2021 |
42,000m3 |
45m3 |
| 2022 |
45,000m3 |
47m3 |
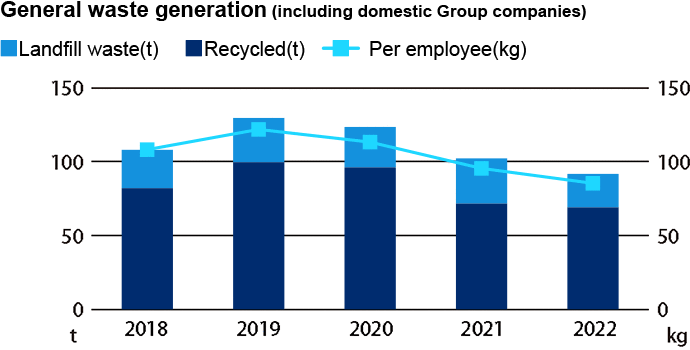
- *Vertical bar, left scale: Total amount; line chart, right scale: Amount per employee
| FY |
Total waste generation |
Landfill waste |
Recyclable |
Per employee |
| 2018 |
107.7t |
26.0t |
82.0t |
108.2kg |
| 2019 |
129.5t |
30.0t |
99.6t |
121.9kg |
| 2020 |
123.4t |
27.4t |
96.1t |
113.3kg |
| 2021 |
102.1t |
30.6t |
71.6t |
95.5kg |
| 2022 |
91.8t |
22.7t |
69.0t |
85.4kg |
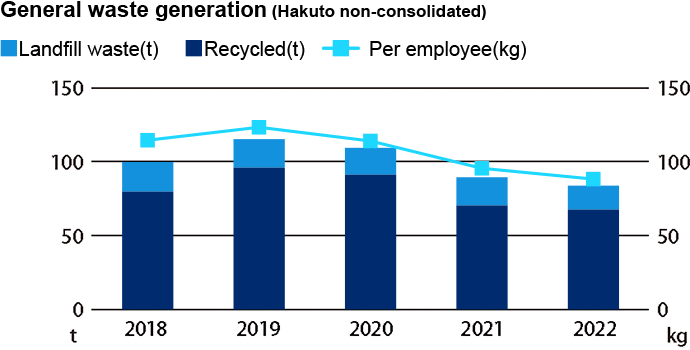
| FY |
Total waste generation |
Landfill waste |
Recyclable |
Per employee |
| 2018 |
99.8t |
20.0t |
79.8t |
114.6kg |
| 2019 |
115.4t |
19.3t |
96.0t |
123.4kg |
| 2020 |
109.4t |
18.2t |
91.2t |
114.1kg |
| 2021 |
89.5t |
19.1t |
70.4t |
95.6kg |
| 2022 |
83.8t |
16.2t |
67.6t |
88.3kg |
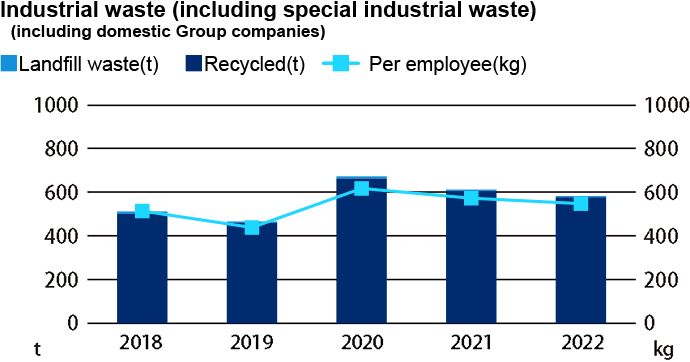
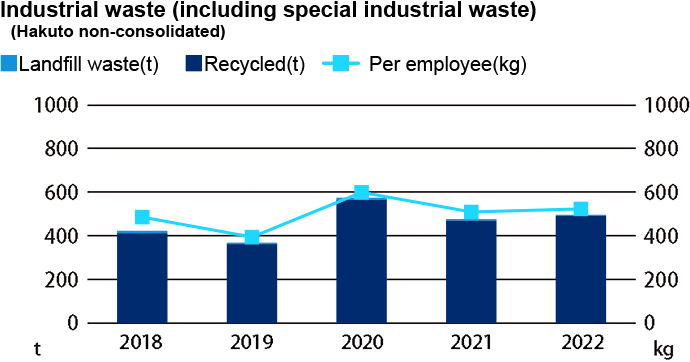
Industrial waste (including special industrial waste)
- *Vertical bar, left scale: Total amount; line chart, right scale: Amount per employee
| FY |
Total waste generation |
Landfill waste |
Recyclable |
Per employee |
| 2018 |
512.7t |
11.7t |
501.0t |
514.7kg |
| 2019 |
466.8t |
6.9t |
459.9t |
439.1kg |
| 2020 |
673.9t |
10.2t |
663.7t |
618.3kg |
| 2021 |
613.0t |
7.1t |
605.9t |
573.5kg |
| 2022 |
596.1t |
5.7t |
577.8t |
548.6kg |
| FY |
Total waste generation |
Landfill waste |
Recyclable |
Per employee |
| 2018 |
424.1t |
11.0t |
413.0t |
486.9kg |
| 2019 |
369.6t |
6.9t |
362.7t |
395.2kg |
| 2020 |
575.7t |
10.2t |
565.5t |
600.3kg |
| 2021 |
477.8t |
7.1t |
470.7t |
510.5kg |
| 2022 |
504.0t |
5.7t |
491.9t |
524.4kg |
